How many Google reviews does a dental practice need? 1,532 UK towns measured
We searched every city, town and suburb in the United Kingdom for a dentist, and measured the 6,314 practices ranking in them. The answer depends on how many practices compete in your town: 70 Google reviews holds a place on the map where three to five compete, 246 where twelve or more do. Five years of search data then shows what patients are asking for, when they ask, and which counties are still open.
Key findings. We searched 1,532 UK places and the 6,314 dental practices ranking in them on 13 September 2026. Two terms used throughout: a map pack place is one of the three practices Google shows on the map at the top of the results, and search share is our estimate of how much of the Google traffic to practices in a town each practice receives.
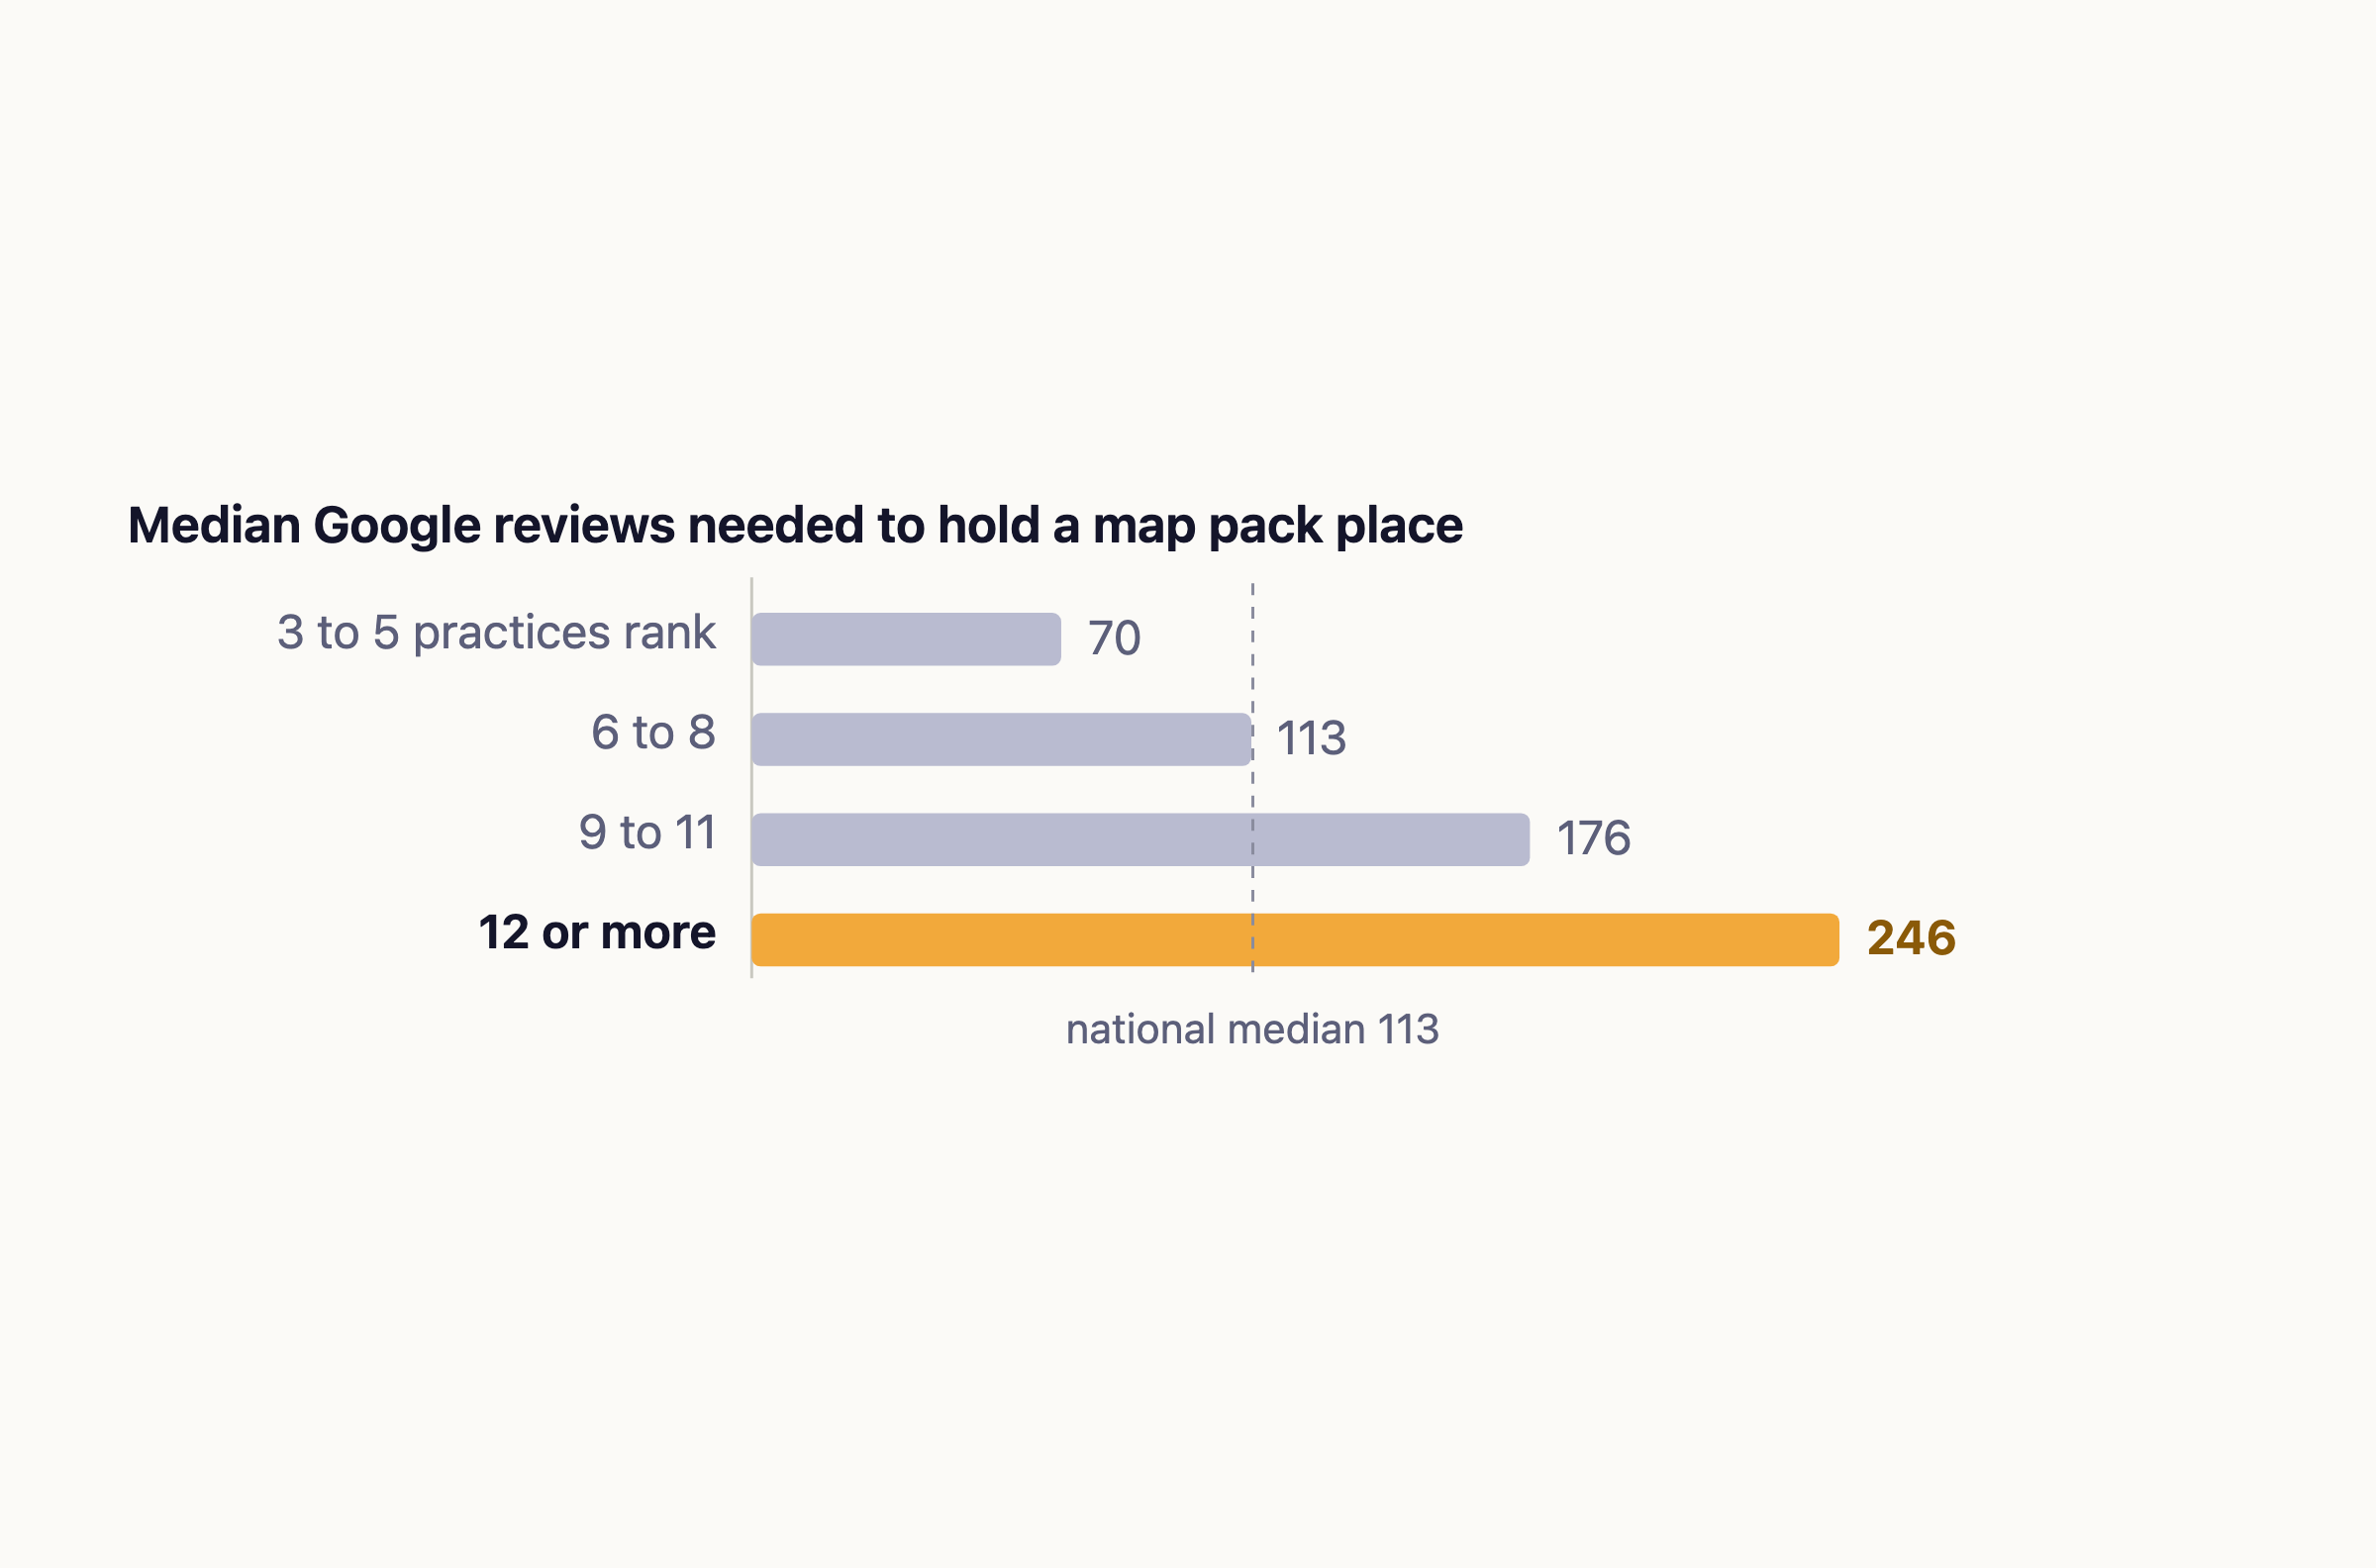
- The bar for a map pack place is a median 113 reviews nationally, but that national figure is not a target for anybody: it is 70 where three to five practices compete and 246 where twelve or more do.
- Star ratings separate almost nobody: the median is 4.8 and 72% of practices in a map pack sit at 4.6 or better. Review count is what varies.
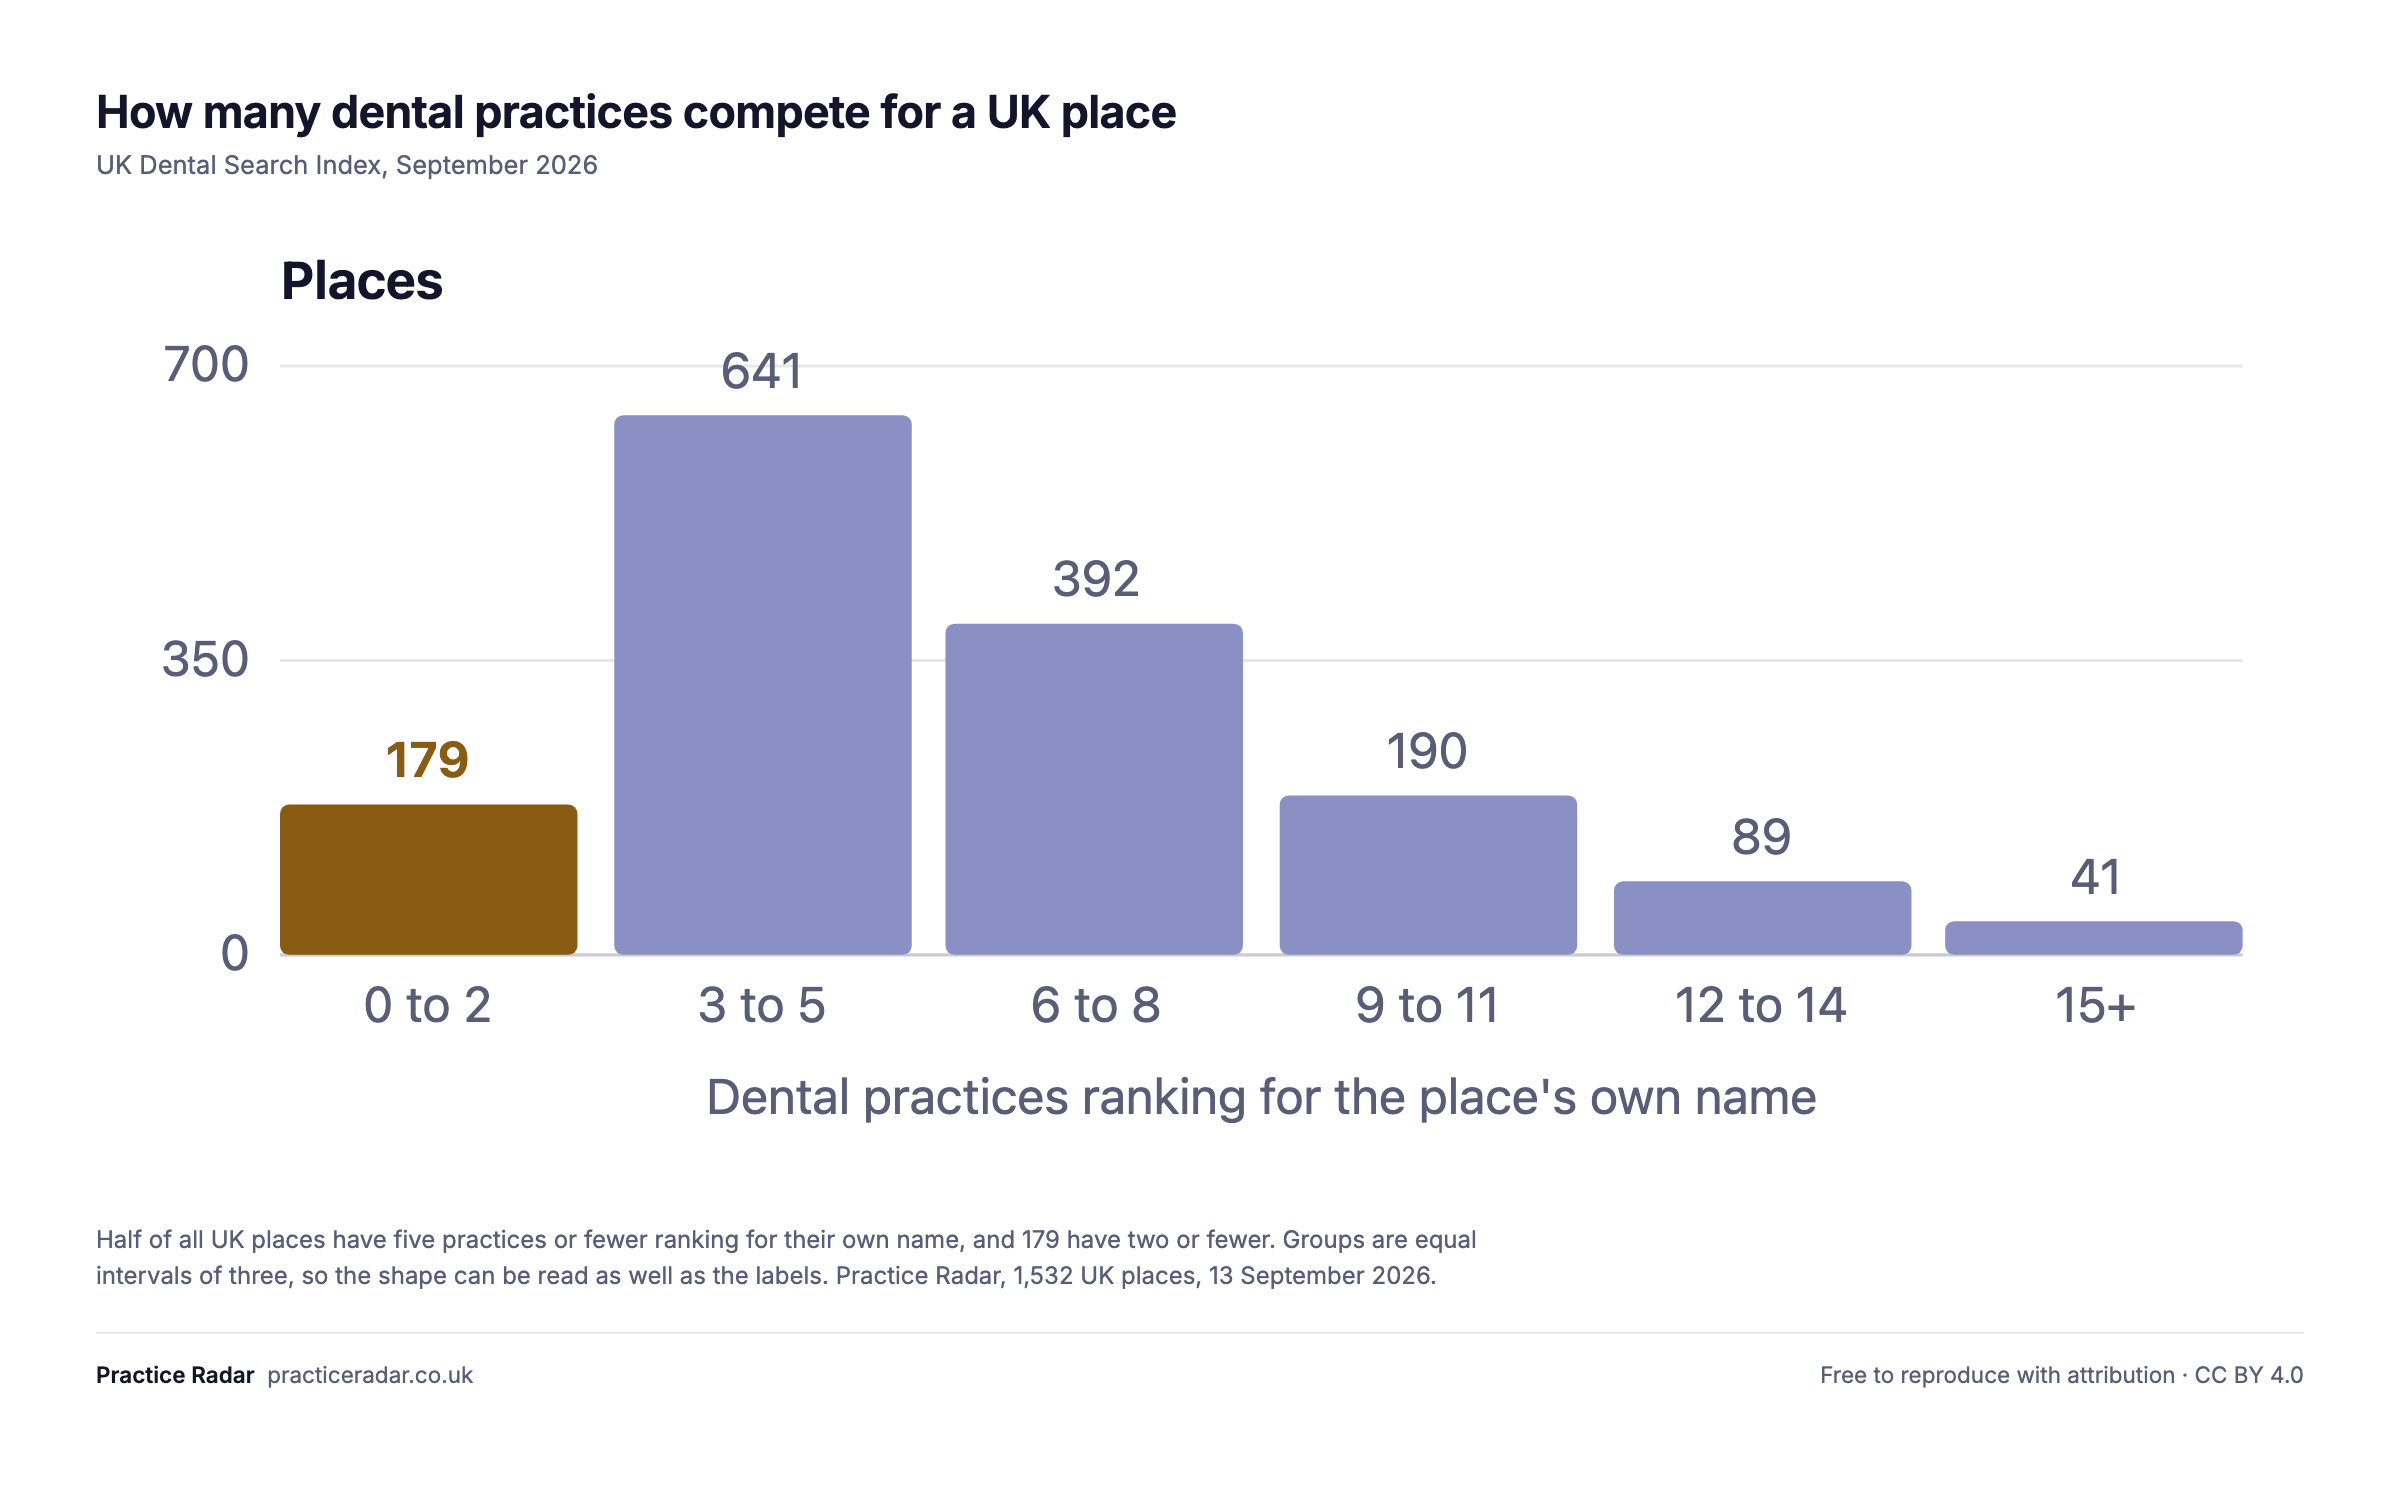
- The median UK place has five dental practices ranking for its own name. 53% of places have five or fewer, 24% three or fewer.
- In towns with three or more practices we could measure, the top three take 94.2% of the search share and the leader alone 55.3%. That is mostly a function of how few compete.
- A median of four of the top ten search results are a practice in that town. The other six are directories, the NHS, the regulator and social networks.
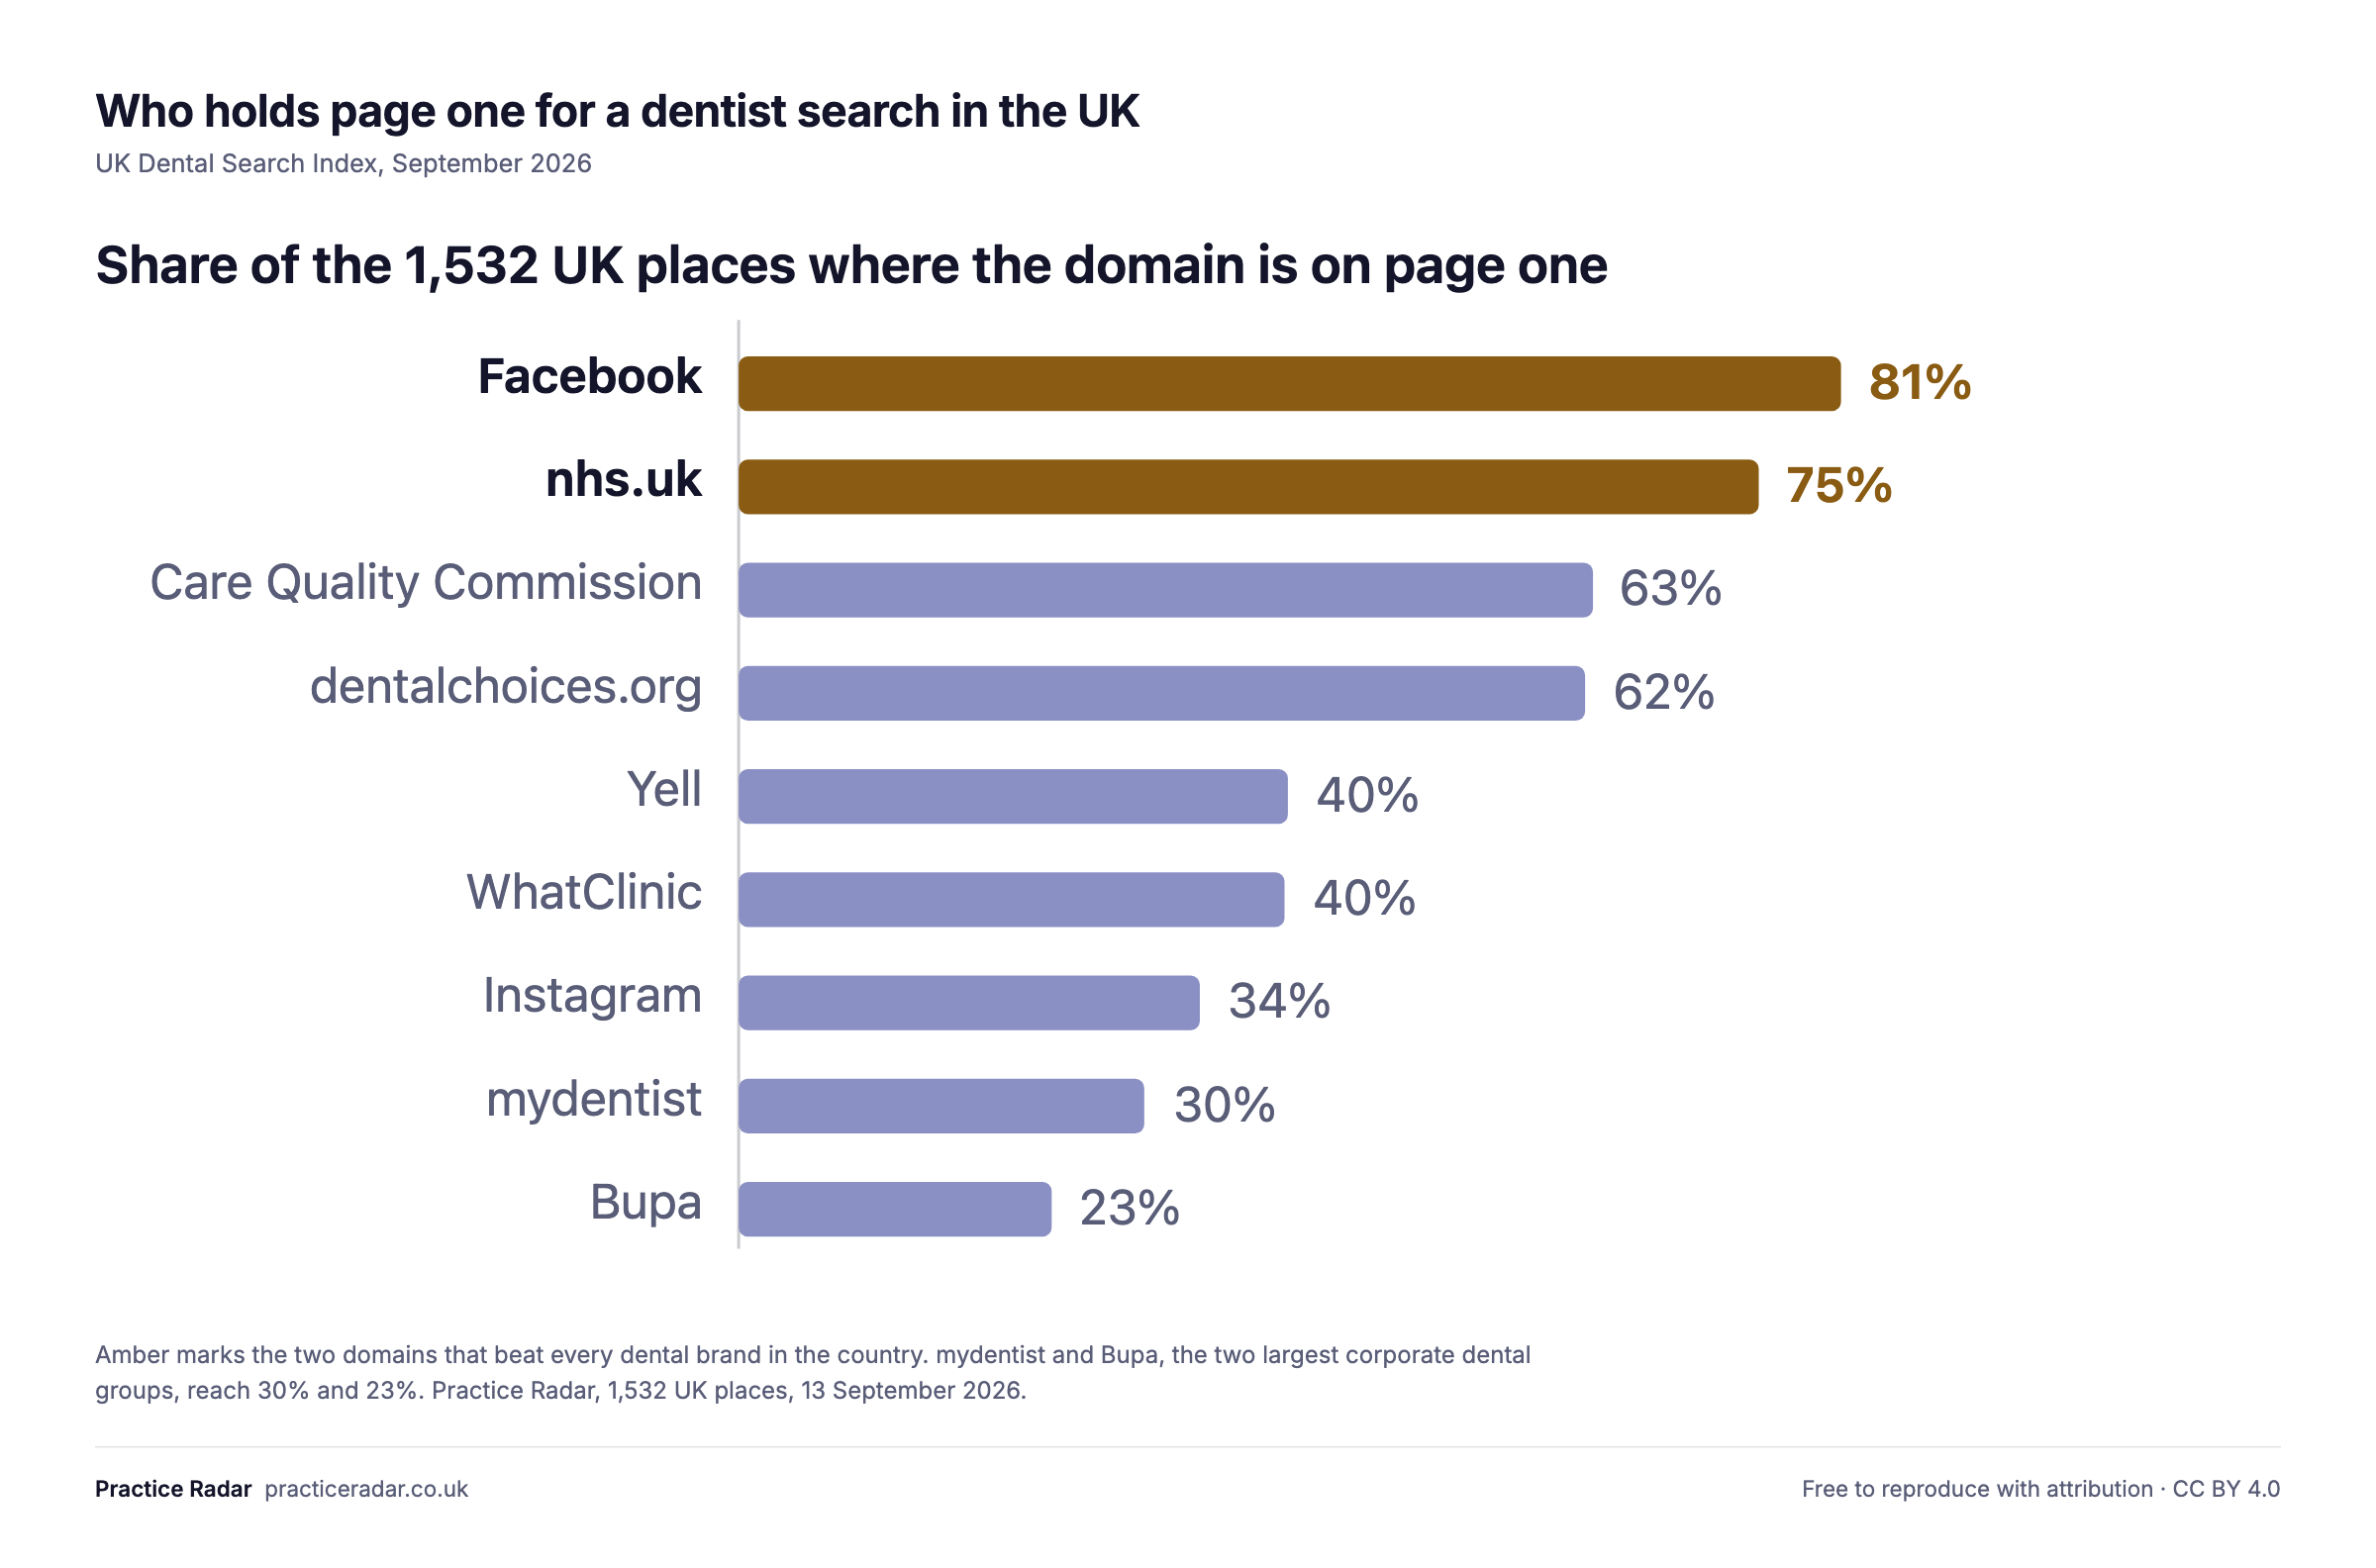
- Facebook ranks in 81% of UK places, ahead of the NHS website at 75%. No dental brand reaches a third of the country.
- Region predicts nothing. Apparent regional differences are town size wearing a regional label.
1. Your star rating is table stakes. Your review count is what decides it.
Across 2,537 practices holding a map pack place with a review count, the median rating is 4.8 and 72% sit at 4.6 or better. Ratings cluster so tightly that they separate almost nobody. Review volume does the opposite. Line up every practice holding a map place by review count: the one a tenth of the way up has 12 reviews, the one nine tenths of the way up has 557, a gap of 46 times.
"Practices ranking in the town" here, and everywhere below, means every dental practice appearing anywhere on page one when the town's own name is searched. The national median for a pack place is 113 reviews, but that single figure is a national average, and no practice competes in a national average. The number that matters is the one for a town your size.
| Practices ranking in the town | Median reviews to hold a pack place | Plausible range |
|---|---|---|
| 3 to 5 | 70 | 60 to 77 |
| 6 to 8 | 113 | 94 to 131 |
| 9 to 11 | 176 | 151 to 201 |
| 12 or more | 246 | 214 to 315 |
See this for your own town.
Every practice competing with yours on one map, sized by the share of local search each one holds, re-checked every week.
Run on our own practice first: ninth in its town's searches in May, first in September. Page-one keywords: 6 in May, 194 now.
Thirty days free. No card, and nothing starts automatically when it ends.
2. A UK dental market is five practices, not fifty
The median place in the United Kingdom has five dental practices ranking for its own name. Not fifty. Five.
Throughout this report, "practices ranking" means every dental practice appearing anywhere in the page one organic results for that place's own name, counted once per place. It is the same definition in every table below.
More than half of all UK places have five or fewer. Almost a quarter have three or fewer. And 179 places, better than one in ten, have two or fewer practices visible in search at all.
| Practices competing for a place's own name | Places | Share of the UK |
|---|---|---|
| None at all | 8 | 0.5% |
| One or fewer | 49 | 3.2% |
| Two or fewer | 179 | 11.7% |
| Three or fewer | 368 | 24.0% |
| Five or fewer | 820 | 53.5% |
| Eight or fewer | 1,212 | 79.1% |
This is what the dental access shortage looks like from the patient's side of the screen. In a quarter of the country, somebody searching for a dentist in their own town is choosing between three names or fewer.
3. "The top three hold 94%" is arithmetic, not dominance
Across the 1,222 places with enough practices to price, the top three take a median 94.2% of the search traffic Google sends to practices in that town, and the leader alone 55.3%. Those numbers are quotable and close to meaningless on their own, because concentration is mostly a function of how many practices compete rather than how strong the leaders are.
With 1,222 places we can show the whole curve. Every figure carries the range it moves across when the places are resampled 4,000 times.
| Practices ranking in the place | Share held by the top three | Plausible range | Places |
|---|---|---|---|
| 3 to 5 | 99.9% | 99.8% to 100% | 520 |
| 6 to 8 | 90.7% | 88.9% to 92.1% | 381 |
| 9 to 11 | 78.0% | 76.2% to 80.6% | 190 |
| 12 to 14 | 69.5% | 66.5% to 75.6% | 89 |
| 15 or more | 64.4% | 54.6% to 75.5% | 42 |
4. Six of the ten results are not a practice in that town
The five practices in the second finding are every practice that ranks anywhere on page one. Counted by position rather than by practice, a median of four of the top ten organic results are a practice in that town. The other six go to directories, social networks, the NHS, the regulator and national chains. In 516 places, one in three, the first organic result is not a practice in that place at all.
5. Facebook outranks the NHS, and both outrank every dentist
No dental practice, group or brand in the country appears in more than a third of UK places. Seven non-clinical domains beat all of them.
| Domain | UK places it ranks in | Share of the UK |
|---|---|---|
| 1,236 | 81% | |
| nhs.uk | 1,144 | 75% |
| Care Quality Commission | 958 | 63% |
| dentalchoices.org | 949 | 62% |
| Yell | 616 | 40% |
| WhatClinic | 612 | 40% |
| 517 | 34% | |
| mydentist | 455 | 30% |
| Bupa | 351 | 23% |
mydentist and Bupa are the two largest corporate dental groups in the UK. Both are beaten by a social network and by a regulator.
6. Region predicts nothing
Ranked by region, the numbers look like a story. Wales sits at 99.3% and London at 83.9%, and seventeen of the 66 regional pairs separate cleanly.
They are an artefact. The regions differ in what kind of place they contain. London in this data is 44 places, 22 of them boroughs, with a median of ten practices competing; the North East is towns with a median of four. Compare towns with the same number of competing practices and the regional differences vanish: 6 of 166 pairs separate, where chance alone produces about 8.
With regional cells between 42 and 166 places, the finding is not that regional differences are unproven. It is that there are none. Anyone selling regional dental search insight is selling you town size.
7. Most published local share figures overstate groups, badly
Search visibility is usually measured per domain. That is fine for a practice with one website and one address. It is badly wrong for a group of practices sharing a site, because traffic earned by every location is credited to whichever town you happen to be looking at.
| Measured at domain level | Apparent share | Measured on the town's own pages |
|---|---|---|
| A 22-practice group, in Maidstone | 71.8% | 3.3% |
| A three-practice group, in Barnet | 47.3% | 2.5% |
| A national insurer, in Chester | 7.9% | 0% |
The groups have done nothing wrong. Their national traffic is real; it is simply being counted in the wrong town. The effect on everyone else is real. Correcting Maidstone moved the leading independent practice from an apparent 7.3% to a measured 25.8%, and from second place to first.
8. Repair is growing steadily. Cosmetic is splitting.
Everything above is a single day's reading. This section adds five years of it. The dental marketing trade sells cosmetic growth, and five years of weekly search data says the demand is moving somewhere less glamorous.
Wisdom tooth removal is up 112% over five years, root canal 47%, tooth filling 41%, the hygienist 38% and dentures 33%. Wisdom tooth removal, root canal, tooth filling and the hygienist each rose in every one of the five years, and dentures in four of them, which is what separates a trend from an event. Cosmetic work has split rather than risen together: composite bonding is up 66%, teeth whitening only 11%, and veneers are down 10%. A practice reading the category as one trend has been reading it wrong.
Searches naming a treatment lead five-year growth; generic searching falls hardest
Two searches are missing from that chart and the reason matters more than the numbers would have. Dental implants and dental crown each carry a burst of ten and six times their own median, six sustained weeks in July 2024 and February 2026 respectively. We cannot attribute either. Measured against the year before such a burst the treatment looks transformed, and against the elevated year after it looks collapsed, so both are excluded rather than reported as trends.
9. Generic searching is collapsing
Five years ago the front door was somebody typing "dentist near me" and choosing from a list. That search is down 44% and "dentist" itself is down 7%, while 11 named treatments rose by more than a fifth. People arrive knowing what they want.
Searches naming a treatment rose while searches for a dentist fell by almost half
The other movement worth watching is who patients expect to pay. "Private dentist" rose 20% in the last year alone against 6% for "NHS dentist", after four flat years. That is a recent inflection rather than a trend, and it should be watched rather than banked.
10. Demand arrives in September and January
September runs at 116 against an eleven-month average of 100, and July at 87. That is a 33% swing between the best month and the worst, with January the second peak and December and midsummer the troughs.
September is the peak, December and July the troughs, a 33% swing
Recruitment, campaign timing and the months a practice chooses to push a treatment should follow that shape, and most practices spread their spend evenly across a year that is not even.
11. Competition piles into the cities; demand per practice is highest in London and the east
They are not the same places. The left map is every one of the 1,469 places carrying a coordinate, sized by how many practices rank for that place's own name. The right map prices the demand by county: circle size is total monthly searches, and shade is how many monthly searches each competing practice gets, which is the number that decides how hard a county is to win.
Competition piles into the cities; London has by far the most demand per practice
12. The east and north offer the most demand per practice for the lowest review bar
Demand alone is the wrong thing to chase. What decides whether a county is worth entering is how much demand each competing practice gets, set against what it costs to be visible there, and the cost of visibility is the review bar from finding 1. Those are two separate numbers and they need two axes.
The east and north give the most demand per practice for the lowest review bar
The upper left is the quadrant to want: more demand per practice than the median county, and a lower bar to clear. Suffolk is the clearest case, 48 searches per ranking practice against a pack bar of 76 reviews. Norfolk and Durham carry the most demand per practice of any county in that quadrant, 66 and 65, against bars of 108 and 110. Cambridgeshire has more, 71 per practice, but asks 200 reviews for it, which puts it on the wrong side of the bar. North Yorkshire sits at 44 against 86.
The lower right is the quadrant to avoid, and it is largely the home counties and the west midlands. Central Bedfordshire asks for 254 reviews and offers 29 searches per practice. Warwickshire asks 229 for 31. Surrey asks 217 for 33. A practice in those counties is paying the highest price of admission for the smallest room.
Greater London sits off the chart and deserves its own verdict. The arithmetic favours it: 258 searches per ranking practice against a bar of 256 is the best ratio in the country. But a bar of 256 reviews is a multi-year project, not a campaign, so London rewards the practice already established there and punishes the one arriving. If you are in it, reviews are the whole game. If you are choosing where to open, the upper-left counties give you most of the same ratio at a third of the price of entry.
Scotland, Wales and Northern Ireland are reported whole, because Google prices only a handful of counties inside them, too few to compare fairly. England carries 61 searches per ranking practice against a median pack bar of 161 reviews. Scotland has 28 against 51, Wales 22 against 76, and Northern Ireland 27 against 30. England has more than double the demand per practice of any other nation, and a bar between two and five times higher to match. Northern Ireland has the lowest bar in the United Kingdom: 30 reviews holds a map pack place there, against 161 in England. A practice in Belfast or Derry is competing for less demand, but it is competing for it far more cheaply.
Read that alongside finding 1. The review bar is set by how many practices compete, so the counties in the upper left are asking less to win more. That is the whole playbook in one sentence.
Method, and what this is not
One live mobile Google search for "dentist [place]" in every place in the cohort, depth 20, run on 13 September 2026. Organic results were reduced to practice domains after removing directories, regulators, public bodies, social networks and multi-site groups. Each surviving domain's organic search value was priced and expressed as a share of the total across the practices ranking in that place. Local pack occupants were captured with the rating and review count Google reported at the moment of the query. A practice holding a pack place in more than one town is counted once, so a large practice visible across several neighbouring towns cannot weight the review figures twice.
The cohort is every UK location that Ordnance Survey classifies as a city, town or suburban area, plus the 22 London boroughs and 48 Northern Irish towns Ordnance Survey's dataset does not cover. Postcode districts were removed, because "dentist NR29" is not a search anybody makes. Villages and hamlets were excluded from the share statistics, because a place with four practices has a top three near 100% by arithmetic and including them would have inflated every concentration figure here.
A domain ranking in four or more places whose towns span more than 80 miles is treated as a group and removed from the practice population. That threshold is calibrated, not guessed: practices verified by hand as single-site rank across 22 to 44 miles, groups and directories across 219 to 713, and nothing at all falls between.
What this is not. It is not every practice in the UK; it is the 6,314 that ranked on page one for a place's own name, out of roughly eight thousand in England alone. A practice that ranks for nothing does not appear, and its absence is the point of the second finding. Search value is an estimate of organic traffic value, not revenue and not patients. And it is one search on one day: single-place figures are a reading rather than a constant, which is why everything here is reported across the cohort.
Five-year direction, and the demand figures
Findings 8 to 12 use two further sources, collected on 15 September 2026 for $7.13. Direction over time is Google Trends, 262 complete weekly points from September 2021. Trends normalises to 100 within each request, so values from different requests are not comparable: every batch therefore carried a common anchor search and was rescaled on it. Two tiers were needed, because anchoring everything on "dentist" crushed most of the smaller searches to a median of 0 or 1, so mid-sized searches were re-pulled against "invisalign" and the two scales chained on their overlap. Nineteen searches clear the floor of a median weekly value of 5 or more with fewer than one week in ten at 2 or below. Six are too small to measure and are excluded rather than quietly dropped: clear aligners, dental check-up, periodontist, sedation dentist, smile makeover and teeth straightening.
Absolute volume and seasonality are Google Ads monthly search volume. The first and last month of any series is partial and both are dropped, leaving eleven complete months. Volumes are folded on their sorted content words, because Google reports one volume for a whole close-variant group and stamps it on every member: unfolded, "dentist near me", "dentist near ne" and "near dentist to me" each claim 246,000 and the raw total overstates the market by 1.8 times.
Two things are deliberately absent. There is no year-on-year growth taken from the Google Ads data, because its trend field is quantised to Google's volume buckets, so every category reported between -18% and -33%, which means "fell one bucket" rather than anything about dentistry. And there is no regional claim about competition: finding 6 is that apparent regional differences are town size wearing a regional label, so demand is reported by geography while competitive intensity is reported per practice, which controls for it. England is by county; Scotland, Wales and Northern Ireland are reported whole, because Google prices too few counties inside them to compare fairly.
For editors
Everything in this study is free to reproduce with attribution to Practice Radar, under Creative Commons BY 4.0. No permission needed and no embargo.
Charts, ready to publish
- How many dental practices compete for a UK place (PNG, 1600px)
- Who holds page one for a dentist search in the UK (PNG, 1600px)
- Google reviews needed to hold a map pack place (PNG, 1600px)
The data
uk-dental-search-index-2026-09.csv, one row for each of the 1,532 places, with county and coordinates so you can filter to your patch, and a column glossary beside it. If you want a cut for a specific region, county or nation, ask and we will prepare it. The file carries coordinates, so it joins to any geography you already use.
Contact
Jack Henty, who compiled this study, co-owns Bollington Dental Practice in Cheshire and built Practice Radar. He is available for interview and for questions about method. Email hello@practiceradar.co.uk and it reaches him directly.
If a figure here does not match what you find, tell us which place and we will re-measure it.
Questions we get asked about this data
How many dental practices compete in a typical UK town?
Five. That is the median across 1,532 UK places measured on 13 September 2026. More than half have five or fewer.
How many Google reviews does a dental practice need for the map pack?
It depends entirely on how many practices compete in that town. The median is 70 reviews where three to five compete and 246 where twelve or more do. The national median of 113 is not a useful target for any individual practice.
Does dental search competition vary by region in the UK?
No. Apparent regional differences disappear once you control for how many practices compete in a place. Six of 166 like-for-like regional comparisons separate, which is fewer than chance alone produces.
Who ranks first for "dentist" searches in UK towns?
Often not a dentist. In 516 of the 1,532 places measured, one in three, the first organic result is not a practice in that place. Facebook appears on page one in 81% of UK places and the NHS website in 75%.
Can I quote these figures?
Yes, with attribution to Practice Radar, September 2026. The full per-place data is published: download the CSV, one row for each of the 1,532 places, with its county and coordinates, how many practices rank there, the share held by the top three, whether the top result is a local practice, whether Facebook is on page one, and the review counts holding its map pack. A column glossary and the known limits sit beside it. Reuse with attribution under Creative Commons BY 4.0.
See your own town measured
This index is the national picture. Practice Radar reads one town at a time: every practice competing in it, what share each holds, and what it would take to move.
Run on our own practice first: ninth in its town's searches in May, first in September. Page-one keywords: 6 in May, 194 now.
Thirty days free. No card, and nothing starts automatically when it ends.